Detailed Case Exposition
Executive Summary (TL;DR)
A machine-learning layer that scores every Sumo Logic freemium account daily for conversion, churn risk and upsell readiness—raising free-to-paid conversion from 2 % to 5 % and adding AI-backed monetisation credibility ahead of IPO.
Business Outcome & Strategic Leverage
The predictive engine translated usage telemetry into revenue lift and shaped Sumo Logic’s equity story: a scalable freemium funnel governed by data science, not guesswork.
1 · Strategic Context & Market Friction
- Stagnant 2 % conversion threatened pre-IPO revenue targets.
- Manual spreadsheet triage missed churn signals and mistimed upsells.
- Leadership needed credible AI leverage to differentiate in observability market.
2 · Objectives & Delivery Constraints
- Mandate: Lift conversion ≥50 % in six months without new headcount.
- Constraints: Four-person data pod; Spark already licensed; dashboards must plug into Tableau.
- Trade-offs: Prioritise transparent classic ML over deep nets to win GTM trust.
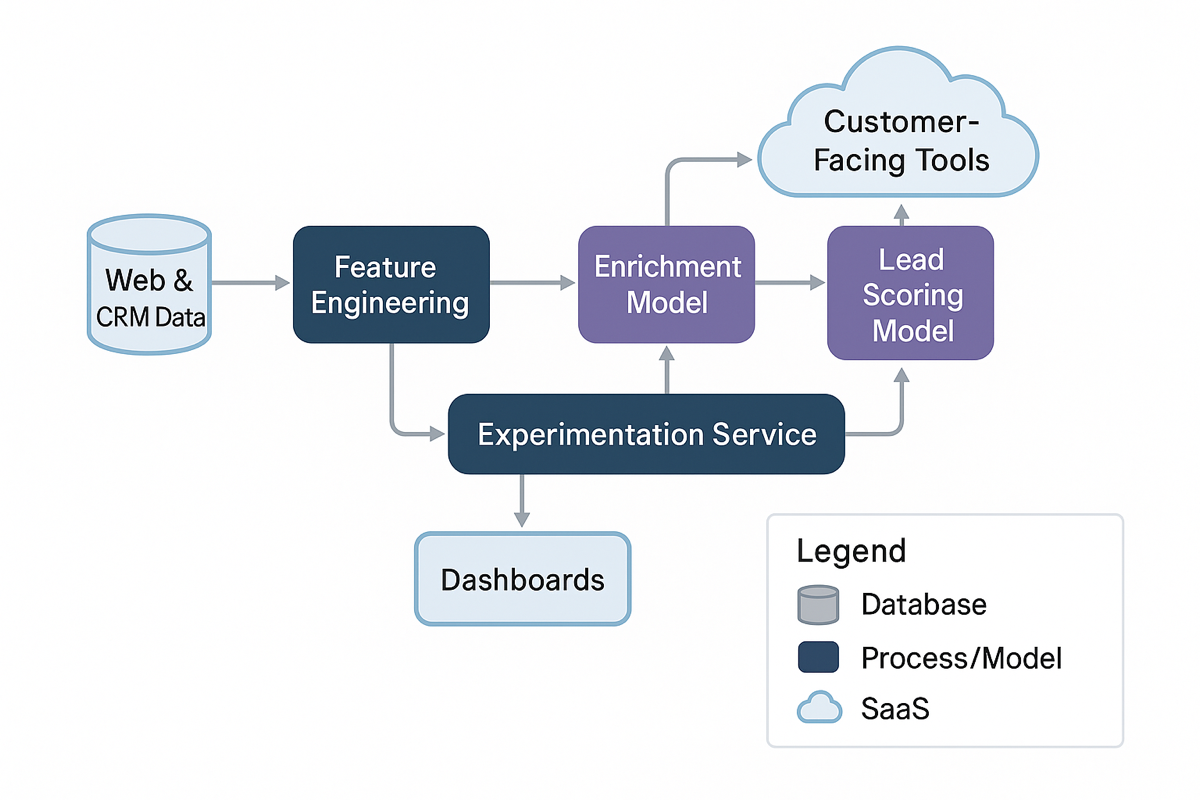
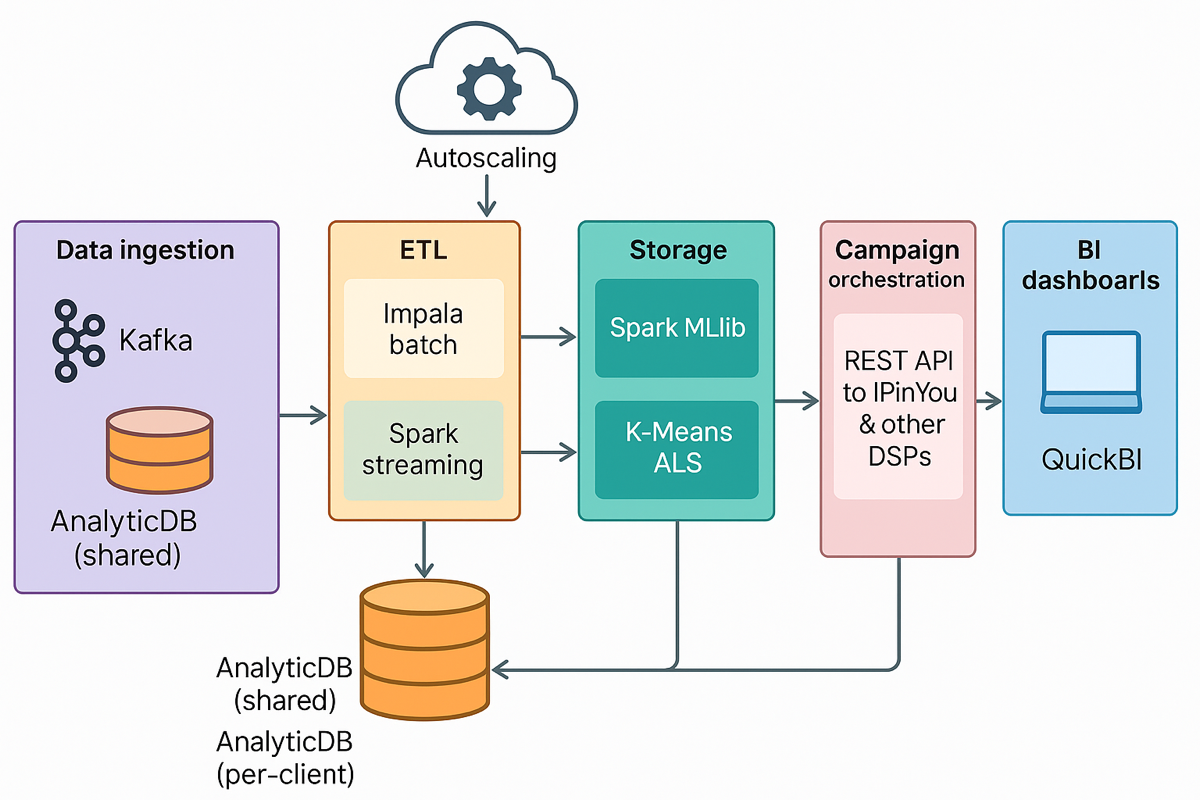
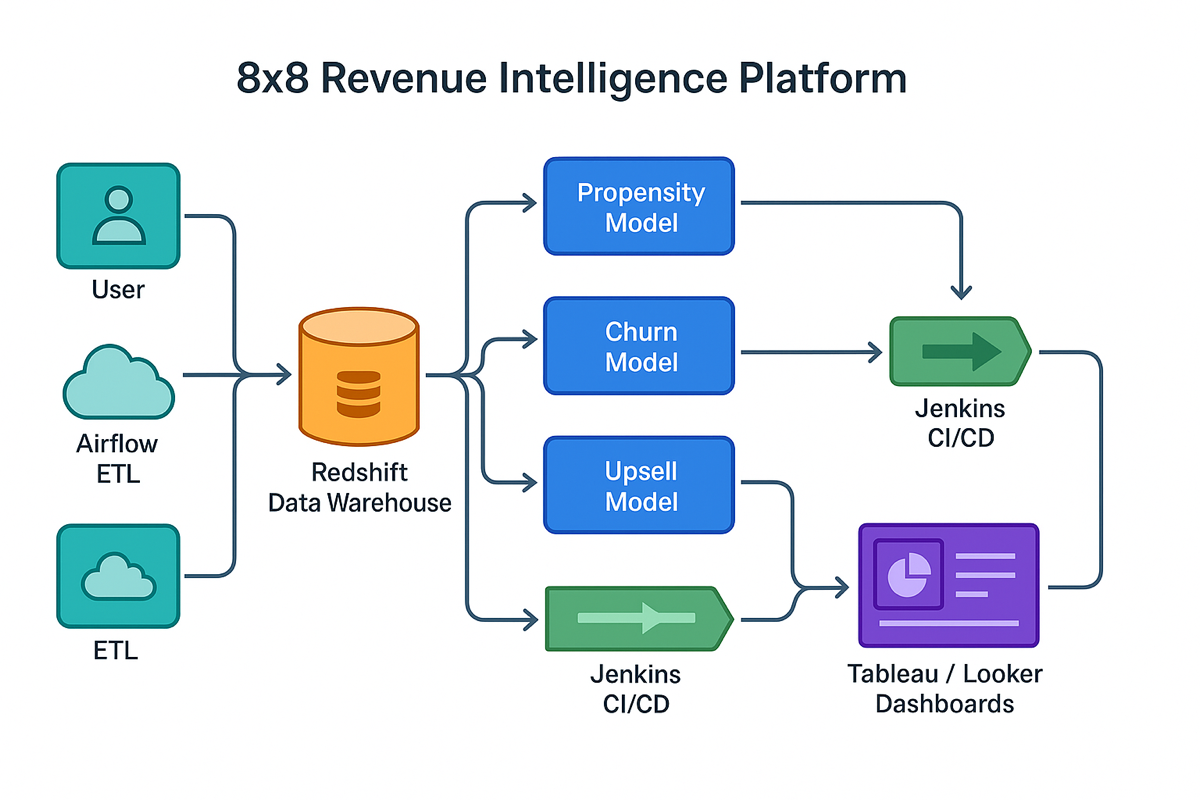
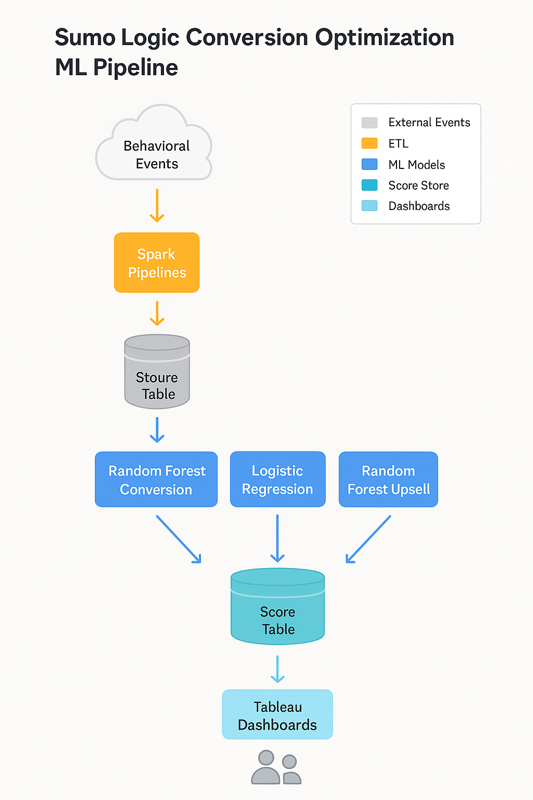
3 · Technical Architecture & Infrastructure Decisions
| Layer | Decision | Rationale |
| Feature Store | Apache Spark pipelines on existing cluster | Scales to 10 M events/week |
| Models | Random Forest (conversion & upsell), Logistic Regression (churn) | High accuracy + explainable feature importance |
| Storage / Queries | SQL on product DB + event logs | Rapid feature derivation |
| Visualisation | Tableau scorecards | Familiar tool for Sales & CS |
| CI/CD | Git + Jenkins | Daily retrain, artefact versioning |
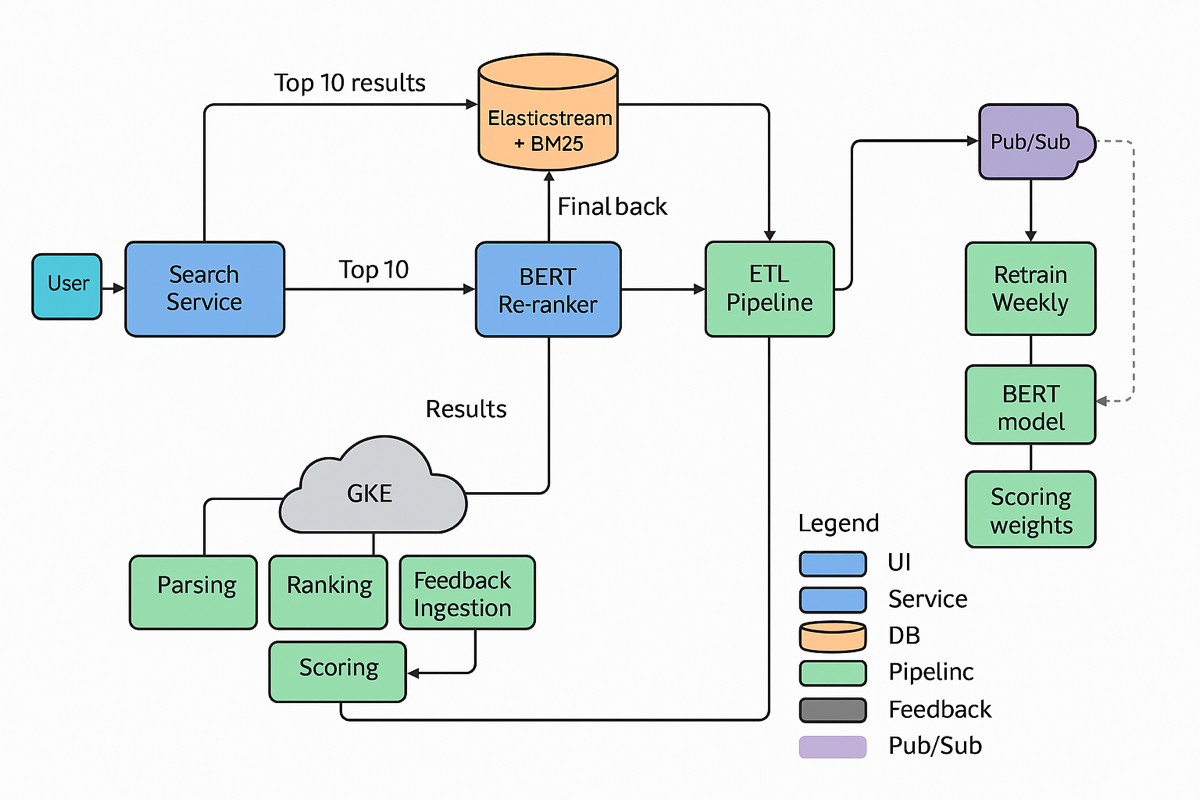
4 · Implementation & System Workflows
- Spark jobs compute daily usage features and decay metrics.
- Models predict three scores per account; results land in SQL views.
- Jenkins retrains weekly, pushes updated pickle files to cluster.
- Tableau dashboards pull live scores; API exposes scores for in-app nudges.
5 · User Experience & Product Storytelling
Sales reps see colour-banded “today’s hot prospects”; CS views churn-risk heat maps; Marketing triggers upgrade emails when upsell readiness crosses 0.7.
6 · Performance Outcomes & Measurable Impact
| KPI | Pre-AI | Post-AI |
| Conversion rate | 2 % | 5 % |
| Upsell precision | Baseline | +25 % |
| CS intervention timing | Manual | Predictive & automated |
| Events processed | 10 M/week | 10 M+/week (no latency hit) |
7 · Adoption & Market Strategy
Dashboards piloted with three CS teams; success stories spread virally. Scores cited in S-1 filings to evidence data-driven growth engine.
8 · Feedback-Driven Evolution
Feature-importance reports surfaced “dashboard-views” as top upgrade predictor—product added contextual tips, further boosting conversions. Proxy churn labels refined via 14-day inactivity threshold tuning.