LAST UPDATE DATE: Mar 19, 2025
Executive Summary (TL;DR)
Inventory distortion—out-of-stocks and overstocks—bleeds $1.77 trillion from global retailers every year. In North America alone, out-of-stock items siphon 5.9 % of grocery sales and fuel costly brand erosion (NielsenIQ OSA Benchmark, 2021).
The AI Inventory Replenishment Advisor embeds in merchandising systems, predicts demand for perishables and high-turn items, and schedules replenishment runs before shelves go bare or coolers overflow. Early pilots signal a 4–6 % sales lift through fewer stockouts and a 10–12 % cut in waste-driven write-downs, paying back in 9–12 months.
Problem / Opportunity
- Inventory distortion covers both overstocks (locked cash) and out-of-stocks (missed sales) — IHL Group, 2023.
- $1.77 T global inventory distortion (out-of-stocks + overstocks) projected for 2023.
- U.S. retailers lose $82 B annually to out-of-stock events; perishables make up a disproportionate share.
- Grocery stores discard ≈ 30 % of perishable food, burning profit and sustainability goals. US grocers lose ≈ 1.4 % of sales to shrink, FMI 2024
Solution Overview
- Probabilistic demand-forecasting ensemble blends calendar, weather, promo, and real-time POS signals.
- Reinforcement-learning reorder agent weighs shelf life, lead time, and vendor MOQs to issue just-in-time POs.
- Continuous shelf-vision loop ingests camera scans to detect phantom inventory and spot aging produce.
- Merchant cockpit shows risk heat-maps, waste forecasts, and one-click override of AI orders.
- EDI & GraphQL APIs sync with ERP, warehouse-management, and last-mile partners; zero Excel exports.
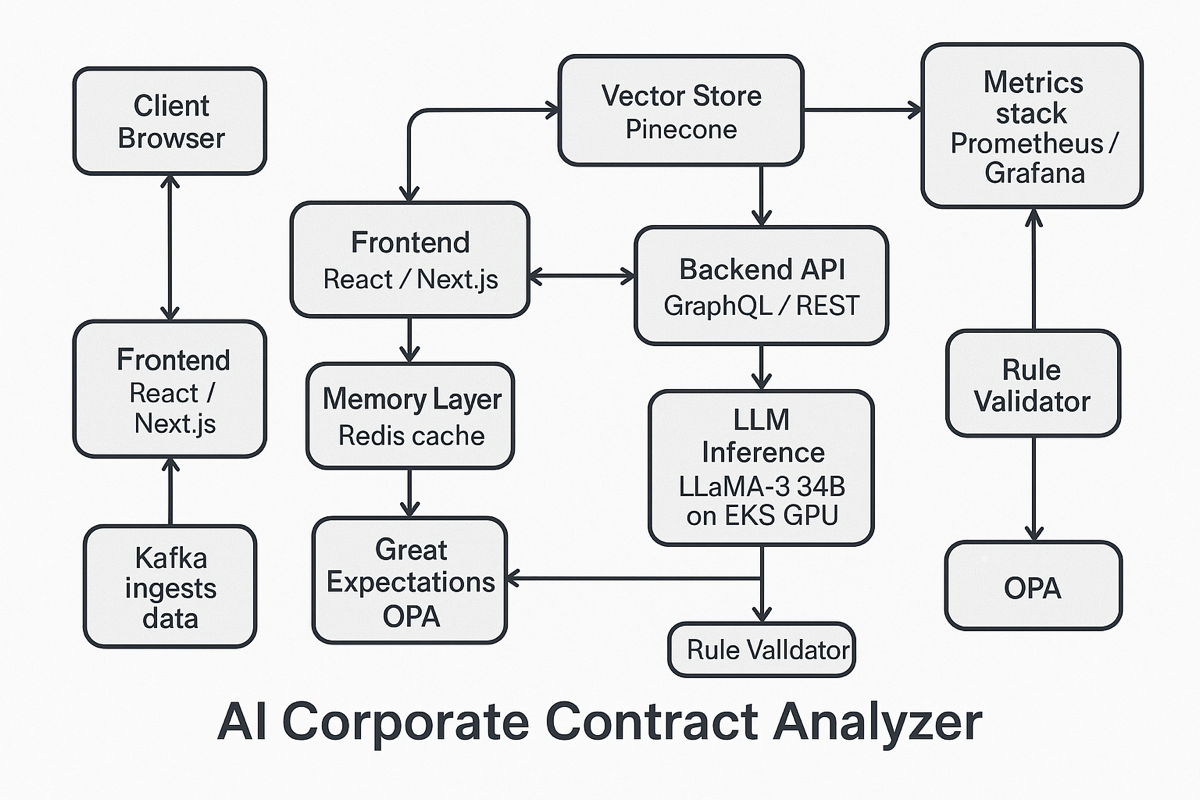
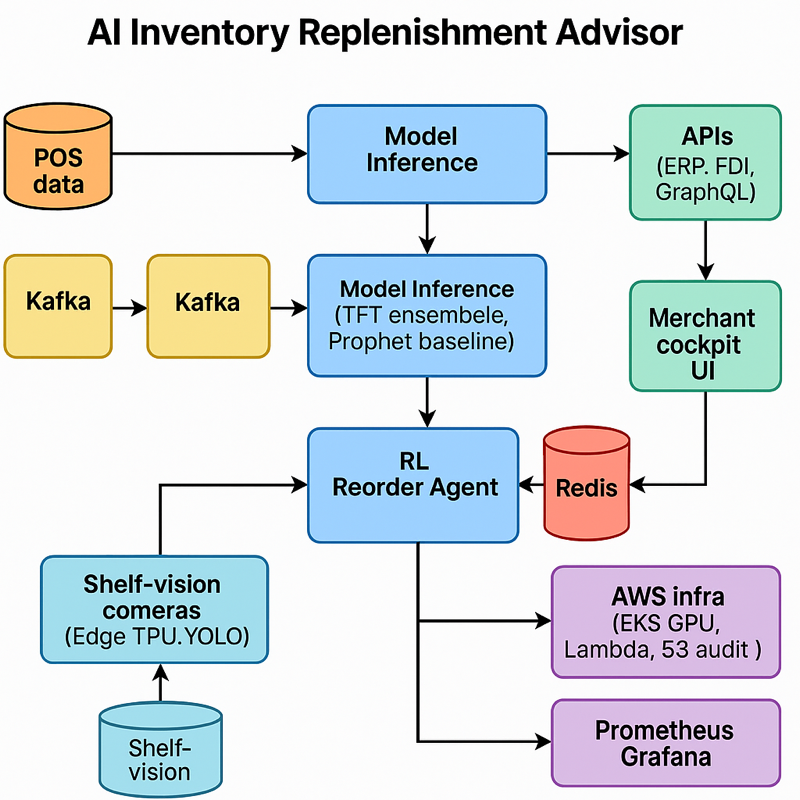
Technical Approach
- Model stack. Fine-tuned LLaMA-3 13B for narrative insights; core forecasting via Temporal Fusion Transformer (TFT) ensemble and Prophet baseline; DQN agent for reorder policy; rule-based validator enforces shelf-life and temperature constraints.
- Continuous shelf-vision loop ingests camera scans to detect phantom inventory and spot aging produce. YOLOv8 + Edge TPU; 96 % planogram-match precision.
- Knowledge & retrieval. Hybrid vector + keyword search (Pinecone) over historical demand, promo calendars, NOAA weather feeds, and U.S. Department of Agriculture (USDA) spoilage tables; embeddings via BGE-Large; LangChain assembles context windows.
- Data pipeline. Streaming POS and IoT cooler data through Apache Kafka → feature store (Feast) → model inference; Great Expectations audits schema drift and null spikes. Cold-chain IoT protocol (MQTT Sparkplug-B)
- Serving & infra. GPU-accelerated AWS EKS; serverless AWS Lambda for low-latency API; deployed in AWS GovCloud with KMS encryption, VPC isolation, SOC 2 controls; blue-green CI/CD via GitHub Actions + ArgoCD.
- Security & audit. OAuth 2.0 / OpenID Connect SSO; AWS CloudTrail records every forecast; immutable Amazon S3 audit vault (7 years); Open Policy Agent (OPA) enforces tenant isolation.
- Front-end & UX. React/Next.js + Tailwind; WebSocket live KPIs; role-based dashboards for merchants, planners, and store managers; Figma system meets WCAG 2.1 AA.
- Observability. Prometheus + Grafana (forecast error, fill-rate, waste); Sentry for UI exceptions; PagerDuty on SLA breach.
Business Metrics (Targets)
| KPI | Target | Notes |
| Stock-out rate reduction | ≥ 30 % | High-demand SKUs |
| Waste reduction (perishables) | 10–12 % | Case-ready meat & produce |
| Sales lift | +4–6 % | Result of improved on-shelf availability |
| Planner adoption | 50 % DAU by Month 3 | Across pilot stores |
| Client CSAT | ≥ 4.6 / 5 | Quarterly merchant survey |
Product Metrics (Targets)
- Forecast MAPE ≤ 18 %; industry baseline for fresh categories ≈ 28 %, FMI/Oliver Wyman 2022
- Median inference latency ≤ 800 ms
- Uptime ≥ 99.7 %
- Waste-alert precision ≥ 0.88
Expected Impact
A regional grocer with $2 B annual revenue (2.3 % of sales, NRF Loss-Prevention 2023) can recover ≈ $22–30 million through higher item availability and lower shrink, while slashing landfill-bound waste—turning inventory drag into velocity and climate goodwill. Cutting 1000 t (short-tons) of waste saves ≈ $88 k in haul-away fees (EPA 2024). Payback accelerates by ≈ 2–3 months for banners where fresh dairy and meat exceed 30 % of sales mix, because higher spoilage rates amplify both waste-reduction savings and on-shelf availability lift
Reference URLs
- Why Inventory Distortion Costs Retailers Trillions — Food Institute
https://foodinstitute.com/focus/why-inventory-distortion-costs-retailers-trillions/ - How Retailers Can Overcome the $1.7 Trillion Inventory Distortion Problem — Total Retail
https://www.mytotalretail.com/article/how-retailers-can-overcome-the-1-7-trillion-inventory-distortion-problem/ - Food Waste in America: 2023 Report — RTS
https://www.rts.com/resources/guides/food-waste-america/ - Out-of-Stocks Cost Grocery Retailers Billions — Food Institute
https://foodinstitute.com/retail/out-of-stocks-cost-grocery-retailers-billions/ - Inventory Distortion Study 2023 — IHL Group
https://www.ihlservices.com/product/inventory-distortion-2023/ - On-Shelf Availability Benchmark 2021 — NielsenIQ
https://nielseniq.com/global/en/insights/2021/on-shelf-availability-benchmark/ - ReFed Insights Engine 2022 — ReFed
https://insights.refed.com/ - FMI Loss Prevention & Shrink Survey 2024 — Food Marketing Institute
https://www.fmi.org/reports/2024-loss-prevention-shrink-study - YOLOv8 Real-Time Shelf Detection Whitepaper — Ultralytics
https://docs.ultralytics.com/shelf-detection-yolov8/ - Sparkplug-B Specification — Eclipse Foundation
https://sparkplug.eclipse.org/specification/
EPA Waste Disposal Cost Calculator 2024 — U.S. EPA
https://www.epa.gov/waste/waste-cost-calculator