Detailed Case Exposition
Executive Summary (TL;DR
Business Outcome & Strategic Leverage
The unified data backbone repositioned 8×8 from reactive churn control to proactive growth management, underpinning board-level confidence and setting a foundation for future AI initiatives such as dynamic pricing and LTV forecasting.
1 · Strategic Context & Market Friction
- Legacy spreadsheets and shadow databases generated conflicting KPIs.
- Revenue teams lacked timely visibility into churn risk or expansion potential.
- Market demanded rapid, data-driven decisions to combat aggressive UCaaS competition.
2 · Objectives & Delivery Constraints
- Mandate: Ship a production-grade data-science capability in < 12 months.
- Constraints: Seven-person team; existing Redshift licence; zero disruption to live billing and support ops.
- Trade-offs: Prioritise interpretable models and nightly refresh cadence over heavier streaming complexity.
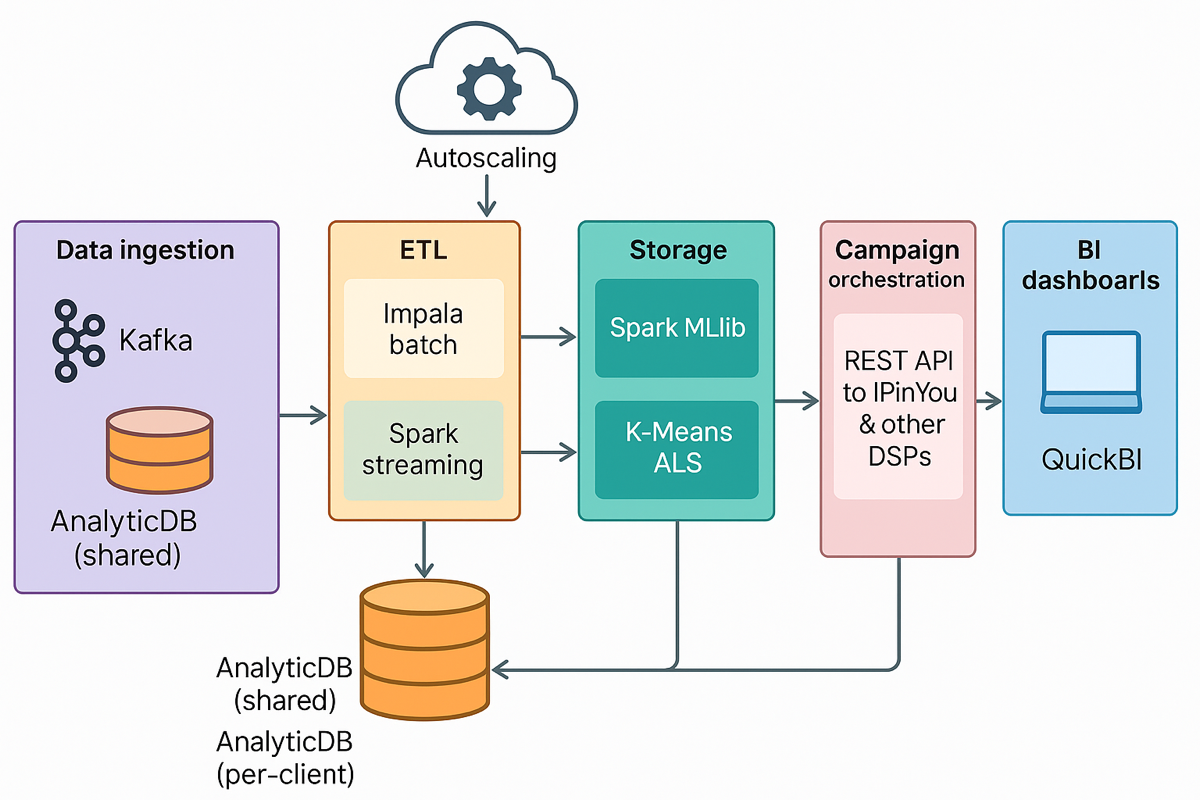
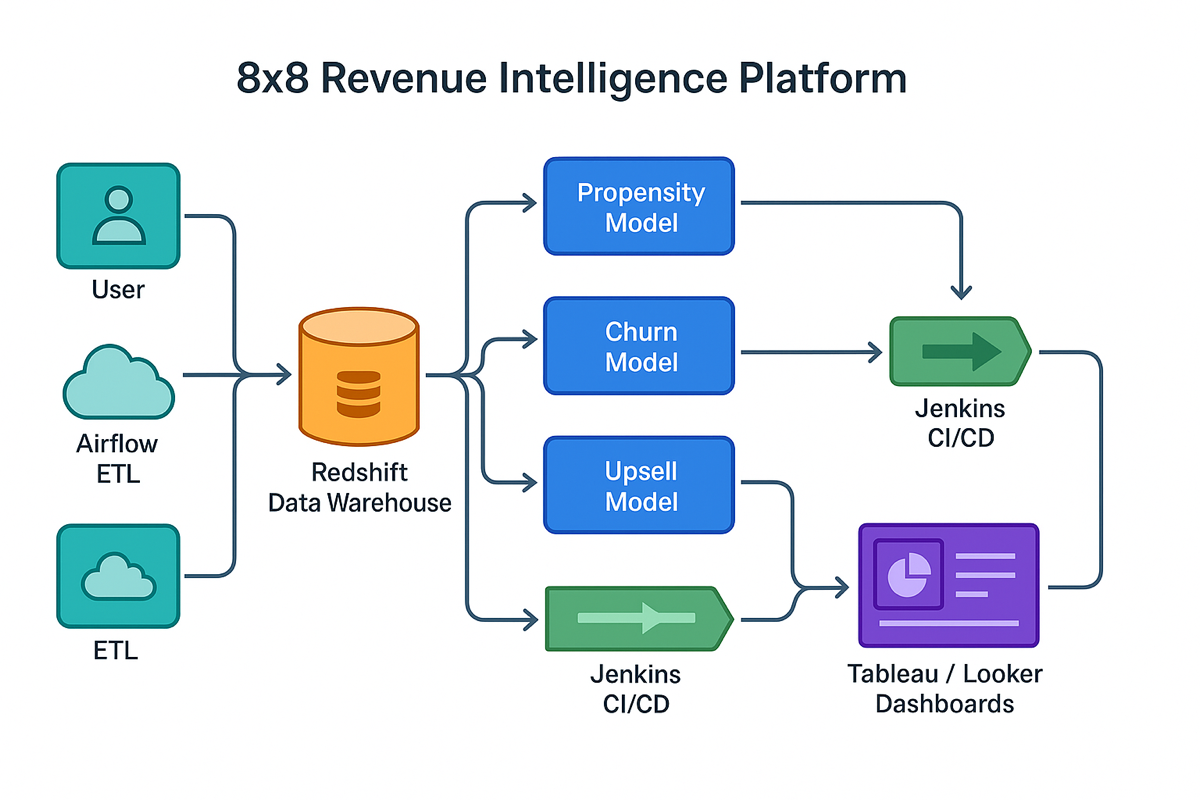
3 · Technical Architecture & Infrastructure Decisions
| Layer | Decision | Rationale |
| Data Core | Amazon Redshift | Columnar performance on 5 TB+ multi-channel events |
| ETL Orchestration | Apache Airflow | DAG-level visibility, retry logic, easy SLA monitoring |
| ML Framework | scikit-learn (logistic + tree ensembles) | High explainability for executive adoption |
| CI/CD | Git + Jenkins | Versioned models, automated promotion |
| Visualisation | Tableau / Looker | Role-based live KPI boards |
| Data Quality | Validation & anomaly rules in Airflow | 80 % error reduction |
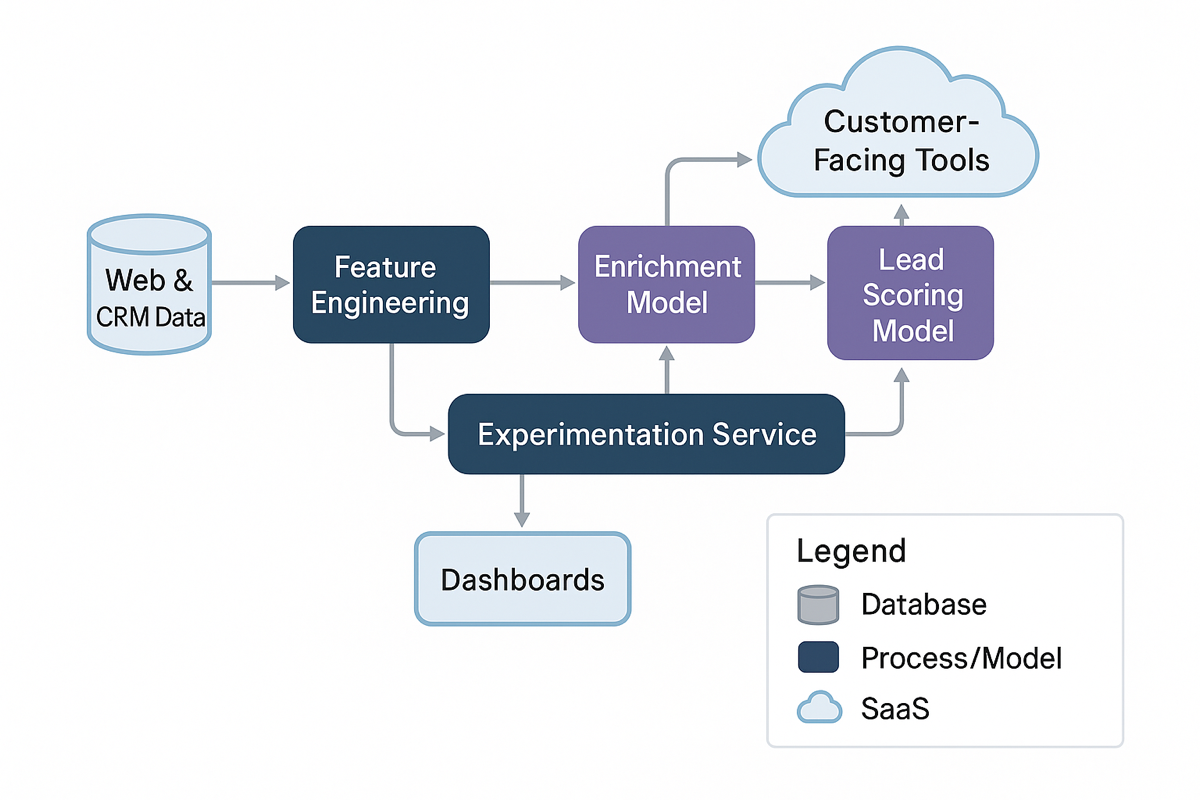
4 · Implementation & System Workflows
- Nightly Airflow DAG extracts CRM, billing, ticket, and usage logs; runs quality checks.
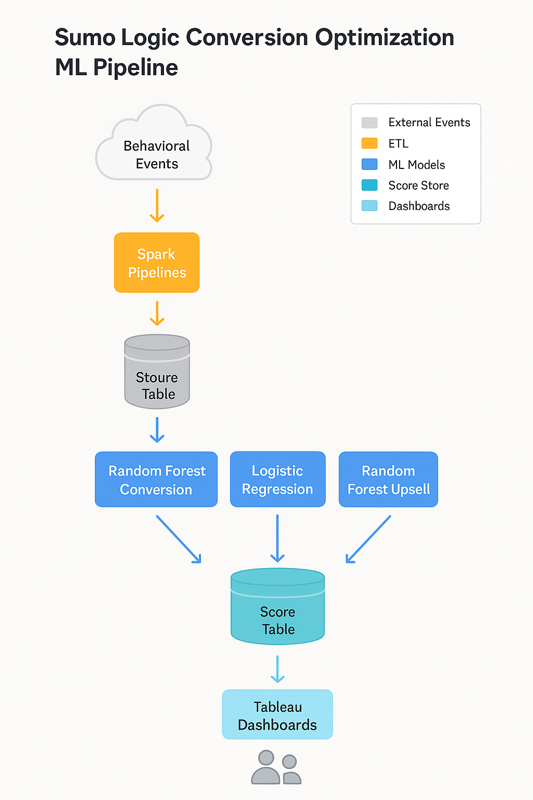
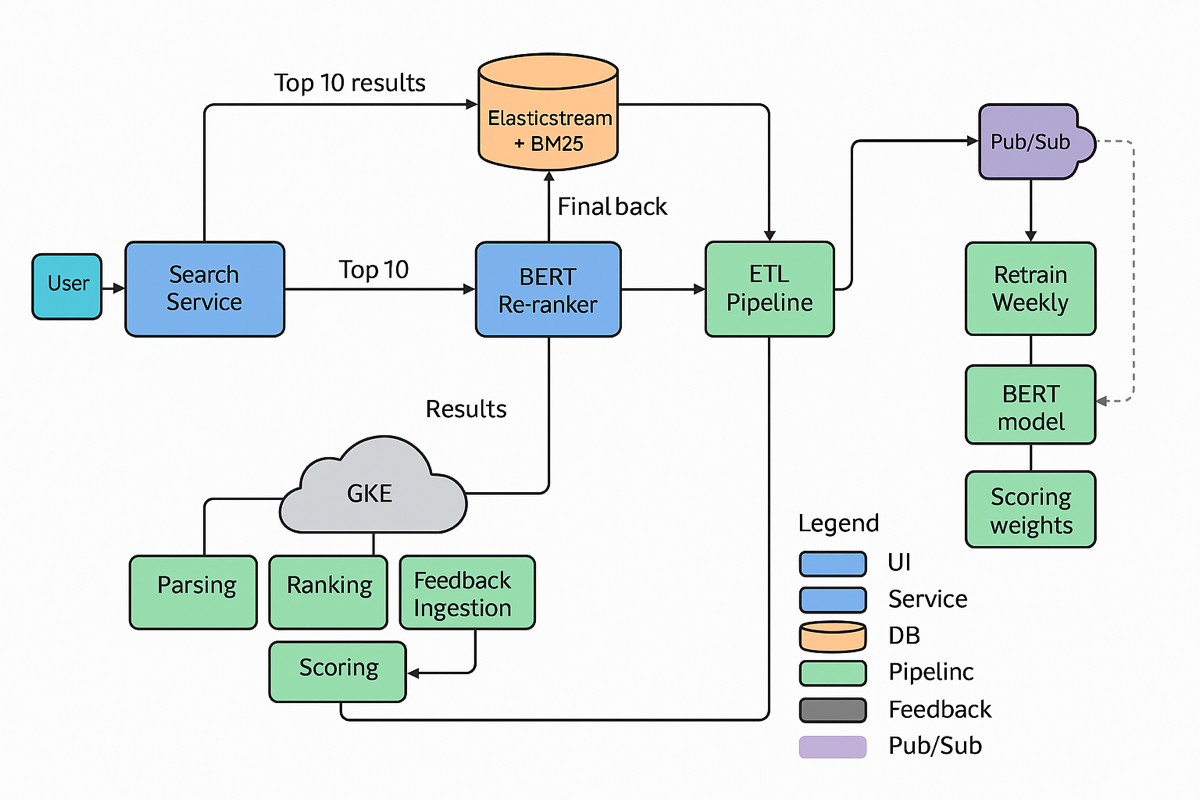
- Model pipelines retrain, validate, and register churn, upsell, and propensity models.
- Deployment via Jenkins pushes scoring code; results materialised as Redshift views.
- Dashboards refresh automatically; alerts fire on threshold breaches.
5 · User Experience & Product Storytelling
Sales teams view colour-coded lead boards; customer success tracks risk heat-maps; executives monitor a composite revenue-health index—each refreshed overnight with drill-downs to root drivers.
6 · Performance Outcomes & Measurable Impact
| KPI | Pre-project | Post-project |
| Net-new revenue | — | +3 % |
| Reporting errors | High, ad-hoc | -80 % |
| Decision latency | Quarterly decks | Near real-time dashboards |
| Data-science headcount | 1 FTE | 7 FTEs |
7 · Adoption & Market Strategy
Pilot dashboards launched to Sales Ops; early wins catalysed rapid roll-out to Product, Support, and Finance. Shared OKRs now reference a single metrics catalogue housed in Redshift.
8 · Feedback-Driven Evolution
Usage telemetry revealed dashboard overload; widgets were consolidated and inline explanations added. Feature-drift monitoring flagged shifts in support-ticket sentiment, prompting quarterly feature-set reviews.